Table of Contents
Ever had a 429 from Claude that just would not clear, no matter how patiently you backed off?
Yeah. That one was never a rate limit.
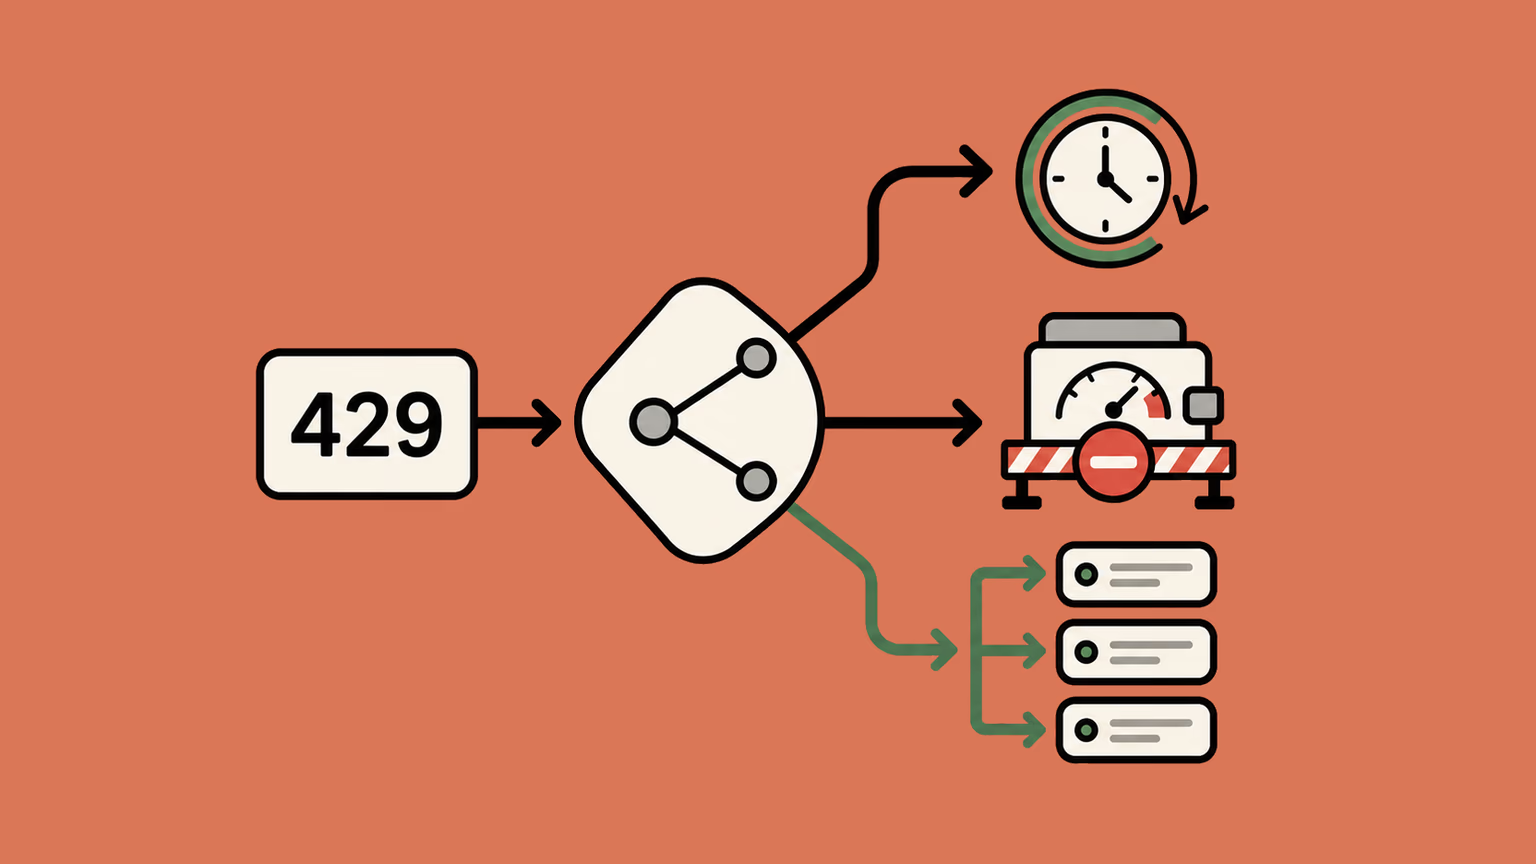
A Claude rate limit error is an HTTP 429 carrying "type": "rate_limit_error", and it means your organization crossed a per-minute request ceiling, a per-minute token ceiling, or its monthly spend cap. Which one decides the fix, and the response body tells you which before you write any retry code.
And the difference matters far more than it sounds, because two of those three conditions get strictly worse the moment you retry them.
The five failures behind one Claude rate limit error
rate_limit_error is not one condition. Anthropic returns the same string for several different situations, and the correct response may be to wait a few seconds or to change a setting that retrying cannot fix.

The Claude API errors reference documents them separately, so you can tell them apart from the response alone.
| What you see | What it actually is | Does retrying help? |
|---|---|---|
429 + rate_limit_error + a retry-after header | A real per-minute limit. You went too fast. | Yes, after retry-after seconds |
429 + rate_limit_error + details.error_code: enforced_spend_limit_reached, and no retry-after | Your usage tier's monthly spend cap | No. Access returns at 00:00 UTC on the 1st |
400 + invalid_request_error, message starting You have reached your specified API usage limits | A spend limit you set yourself in the Console | No. Raise or remove your own limit |
429 right after a sharp traffic ramp | An acceleration limit, not your steady-state limit | Partly. Ramp up gradually instead |
529 + overloaded_error | Anthropic is busy. Nothing to do with you. | Yes, but the queue is global |
That last row is the one that trips people up most. The Claude overloaded error gets searched more than any specific 429 phrasing, and almost every guide lumps it in with rate limits. It isn't yours. A 529 means the API is temporarily overloaded across all users, so no amount of tier upgrading or key rotation on your side moves it.
The second row is easy to misdiagnose. It looks identical to a normal rate limit at the status-code level, the official SDKs will happily auto-retry it, and every retry fails. The tell is the missing retry-after header plus that error_code.
So before anything else, log the full error body. Not err.status. The body.
import anthropic

client = anthropic.Anthropic()

try:
    msg = client.messages.create(
        model="claude-sonnet-5",
        max_tokens=1024,
        messages=[{"role": "user", "content": "hi"}],
    )
except anthropic.APIStatusError as e:
    print(e.status_code)                          # 429
    print(e.response.headers.get("retry-after"))  # None means spend cap
    print(e.body)                                 # the error_code lives here
    print(e.request_id)                           # req_018Ee... for support
The retry-after check on that second line is doing almost all of the diagnostic work. Present means wait. Absent on a 429 means stop retrying and go look at billing.
What actually counts against your Claude rate limits
Now, the per-minute limits. There are three of them running at once, per model, and you can trip any one.

- RPM, requests per minute.
- ITPM, input tokens per minute.
- OTPM, output tokens per minute.
They are enforced per model class, so Sonnet traffic and Haiku traffic draw from separate buckets and can run at full speed at the same time. Worth knowing: on the current lineup, Sonnet 5 has its own bucket while Sonnet 4.6 and 4.5 share a combined one, and the same split applies to Opus 5 versus the Opus 4.x family. Pinning half your traffic to an older Sonnet does not double your Sonnet 5 headroom.
The rate limits documentation also says something that should change how you think about bursts. The limiter is a token bucket, which means capacity refills continuously instead of resetting on a clean minute boundary. A 60 RPM limit behaves much more like 1 request per second than like 60 free requests at the top of every minute. So if you fan out 60 concurrent calls at 12:00:00 you will get rate limited, even though your average for that minute was exactly at the ceiling.
I hit this exact shape of problem building Scholarian, which fetched and ranked over 10,000 academic papers. The moment you write a loop that fans out one model call per document, your average throughput looks perfectly fine on a dashboard and your p99 latency (the slowest 1% of calls) is a wall of 429s, because nothing in that loop is pacing itself.
The one number most people get wrong
For most Claude models, only uncached input tokens count against ITPM.
Specifically: input_tokens and cache_creation_input_tokens count, and cache_read_input_tokens does not. So a cache hit is free as far as your rate limit is concerned, and it is billed at a reduced rate on top of that. (Claude Haiku 3.5 is the exception and does count cache reads.)
Do the arithmetic on that, because it is not a small effect. Say you are on the Start tier with 2,000,000 ITPM on Sonnet 5, and you are running a coding agent that ships roughly 180,000 tokens of context per turn.
Without caching, 2,000,000 divided by 180,000 is about 11 turns per minute for your entire organization.
With prompt caching where 170,000 of those tokens are cache reads, only 10,000 counts against ITPM. That is 200 turns per minute off the exact same limit! Anthropic's own worked example frames it the same way, and it is why they publish your cache hit rate on the Usage page right next to the rate limit charts.
One nuance people miss: cache_creation_input_tokens does count. Writing the cache costs you full ITPM once, and reading it is free. So a workload that keeps rebuilding the cache because the prefix keeps shifting gets the worst of both.
Output is simpler. OTPM is measured on tokens actually produced, in real time, and max_tokens never factors into it. There is genuinely no rate limit penalty for setting a generous max_tokens, so stop shaving it down for that reason.
The headers you should be reading instead of guessing
Every response, including the successful ones, carries your current standing. And most people never look at them.

curl -sS -D - -o /dev/null https://api.anthropic.com/v1/messages \
  -H "x-api-key: $ANTHROPIC_API_KEY" \
  -H "anthropic-version: 2023-06-01" \
  -H "content-type: application/json" \
  -d '{"model":"claude-sonnet-5","max_tokens":16,
       "messages":[{"role":"user","content":"hi"}]}'
Run that and you get back a block of anthropic-ratelimit-* headers. The ones worth wiring into a metric:
anthropic-ratelimit-requests-remaininganthropic-ratelimit-input-tokens-remaininganthropic-ratelimit-output-tokens-remaining- the matching
-resetfields, which are RFC 3339 timestamps rather than durations
Two gotchas here. The remaining values are rounded to the nearest thousand, so treat them as a gauge and not as an accountant. And the generic anthropic-ratelimit-tokens-* triplet reports whichever limit is currently most restrictive, which means the number can jump between input and output accounting between requests without anything being wrong.
Identify the failure and read the remaining-capacity headers before changing retry logic. Backoff cannot fix a spend cap, and tuning it first wastes time.
At one of my previous roles I built an internal tool that pulled the data logs off an AI product and turned them into latency and slowdown reports, and the useful part was never the clever part. It was just having the numbers somewhere you could look at them without reproducing the bug first. Same idea here. Export those three headers as gauges and most rate limit debugging stops being detective work.
Retrying correctly, and where retrying stops helping

The rule in plain English: if the response gave you a retry-after, wait exactly that long. If it did not, double your wait each attempt and add randomness so your workers do not all wake up at the same instant.
import random, time, anthropic

client = anthropic.Anthropic(max_retries=0)  # we handle it ourselves

def call_with_retry(**kwargs):
    for attempt in range(5):
        try:
            return client.messages.create(**kwargs)
        except anthropic.APIStatusError as e:
            if e.status_code not in (429, 500, 502, 503, 504, 529):
                raise
            hinted = e.response.headers.get("retry-after")
            if e.status_code == 429 and hinted is None:
                raise  # spend cap, so retrying is pointless
            wait = float(hinted) if hinted else min(2 ** attempt, 30)
            time.sleep(wait * random.uniform(0.8, 1.2))
    raise RuntimeError("exhausted retries")
The jitter multiplier on the last line is the bit people skip, and it is the bit that matters at concurrency. Without it, 50 workers that all got rate limited at the same moment will all retry at the same moment, and you get a thundering herd that reproduces the original 429 on a fixed schedule forever.
Also notice max_retries=0 at the top. The official SDKs retry twice by default with their own backoff, honoring retry-after. That default is fine for a script. It is not fine when you are also running your own retry loop, because the two layers multiply and you quietly end up with 3x the attempts you thought you configured.
But here is the honest limit of all of this, and it is why the post does not end here.
Retries are a queueing strategy. They smooth out bursts against a ceiling you are near. They do nothing at all when you are structurally above the ceiling, because every retry is just another request competing for the same bucket. If your steady-state demand is 3,000,000 input tokens per minute and your limit is 2,000,000, no backoff curve in the world fixes that. You need more ceiling.
Setup is done, now the part that actually raises the ceiling
Everything above happens inside one API key against one endpoint. Reading the error properly and then caching aggressively will genuinely resolve most Claude rate limit errors, and if you are a solo developer on one key, honestly stop reading here and go turn on prompt caching. You will get more out of that one afternoon than out of any infrastructure.

But if you are past that point, the interesting fact is that "Claude capacity" is not one pool. It is four, and they are metered by different organizations running different quota systems.
Four separate places Claude capacity lives
1. The direct Claude API, by usage tier. Start, Build, Scale, then Custom. Each tier carries both per-minute limits and a monthly spend cap, and as of mid-2026 those caps sit at 500USD on Start, 1,000USD on Build, and 200,000USD on Scale. Tiers move up automatically as you build usage history, and you can also request an increase from the Console.
2. Amazon Bedrock. Claude on Bedrock runs against AWS service quotas, which are per-account and per-region and adjustable through the Service Quotas console. These have no relationship to your Anthropic tier at all. Bedrock even splits its own quotas across two inference endpoints, tracked separately for the same underlying model.
3. Google's platform. Claude models run there through the model garden against Google Cloud quotas, again on a completely separate meter.
4. Priority Tier. Anthropic sells committed capacity with its own anthropic-priority-* headers and its own bucket, sitting alongside your standard limits rather than replacing them.
The consequence is the interesting part. An organization pinned at 100% of its direct-API ITPM might have an entirely idle Bedrock quota sitting in two regions. The capacity exists, and it is already paid for. The problem is that your application has one base URL and one key, so it cannot reach any of it.
One clarification before moving on, because this is the most common mix-up of all. If your error reads API Error: rate limit reached inside Claude Code on a Pro or Max plan, none of this section applies to you, because that is a subscription meter and not the API. Two different systems, two different clocks, and I wrote about Claude Pro usage limits separately.
Where a gateway changes the math
This is the job an AI gateway does, which you will also see called an LLM gateway or an LLM proxy. It is a proxy that speaks every provider's API shape, sits between your code and the model, and holds the routing decisions your application shouldn't have to.

Let me lead with what it cannot do, because that part gets oversold constantly. A gateway does not raise Anthropic's ceiling. Your Start tier is still your Start tier. If you run one Anthropic key through a gateway and change nothing else, you will hit exactly the same 429 at exactly the same token count, plus a few microseconds of hop.
What it changes is how many buckets a single request can reach, and how fast it gives up on a bad one. Bifrost is Maxim AI's high-performance, open-source AI gateway that unifies access to 20+ providers through a single OpenAI-compatible API. Its retry and fallback layer distinguishes upstream failures from credential failures: it retries 5xx and network errors against the same key, rotates keys for 429, 401, 402, and 403 responses, and moves to the next provider only after the current provider's retry budget is exhausted. That behavior maps directly to the different Claude failure modes in this post.
Pooling keys so one bucket is not the whole story
Rate limits are set at the organization level, so a second organization with its own key is a second bucket. A gateway can treat several keys as one logical pool.
{
  "providers": {
    "anthropic": {
      "keys": [
        { "name": "primary",  "value": "env.ANTHROPIC_API_KEY",   "models": ["*"], "weight": 0.7 },
        { "name": "overflow", "value": "env.ANTHROPIC_API_KEY_2", "models": ["*"], "weight": 0.3 }
      ]
    }
  }
}
Traffic splits 70/30 by weight. But the part that matters for 429s is what happens on failure. Bifrost rotates keys when the failure is bound to the credential rather than to the request, which it defines as 429, 401, 403 and 402. A rate limited key gets marked used for that cycle and the request carries on against another key. Auth and billing failures mark the key dead for the remainder of that request. Once every key has been tried, the set resets and a fresh weighted round begins.
Key selection is scored rather than round robin, using recent error rates, latency, and observed rate limit hits, with weights recomputed on a short interval and penalties decaying once a key recovers. That is adaptive load balancing applied to credentials instead of servers, and it matters here because a key that just returned a 429 is a bad destination for the next 30 seconds specifically, and not permanently.
Falling back across channels, not just keys
Key pooling only helps if you have more keys. Falling back across the four capacity pools helps even when you don't.
{
  "model": "anthropic/claude-sonnet-5",
  "messages": [{ "role": "user", "content": "..." }],
  "fallbacks": [
    "bedrock/anthropic.claude-sonnet-4-5-20250929-v1:0",
    "vertex/claude-sonnet-4-5@20250929"
  ]
}
Same request, same Anthropic model family, three completely independent quota systems. If the direct API is capped, the call lands on Bedrock's per-region quota, which knows nothing about your Anthropic tier.
The execution detail worth knowing is that each provider in the chain gets its own full retry budget. A primary at max_retries: 3 with two fallbacks also at 3 means up to 12 attempts on one call, so set your client timeout with that in mind. Retries and fallbacks documents the backoff as min(initial × 2^attempt, max) × jitter(0.8-1.2), with defaults of 500ms initial and a 5000ms cap.
And a real gotcha, stated plainly because it will bite you: max_retries defaults to 0. Retries are off until you turn them on.
{ "network_config": { "max_retries": 3, "retry_backoff_initial": 500, "retry_backoff_max": 5000 } }Two more things that buy headroom
Caching at the gateway instead of per service. If four services ask the same question, an application-level cache inside each one misses four times. A gateway cache hits three of them, and every hit is a request that never touches your ITPM at all. Bifrost's version only engages when a request carries an x-bf-cache-key header, defaults to a 5 minute time-to-live and a 0.8 cosine similarity threshold, and can run in exact-match mode with no embedding provider at all. That threshold is the whole product, and I went into why in a post on semantic caching.
Stopping one tenant from eating the org bucket. Your organization limit is shared, so one runaway batch job starves the interactive traffic sitting behind it. Governance limits let you cap consumption per virtual key before the request ever reaches Anthropic, in tokens or in requests, with calendar-aligned reset periods running from 1m up to 1Y. When a cap trips, the gateway reports the breach with its own code instead of a vague 429: token_limited or request_limited on a 429, budget_exceeded on a 402, and 403 for a blocked model or provider. The governance docs carry the full mapping.
That is a real difference in debuggability. "Your batch job hit its token cap" is a fix you can act on in a minute. "Anthropic said 429" is an afternoon.
Pointing Claude Code at it
Since a lot of people arriving at this error are inside a coding agent rather than a Python service, the integration is two environment variables. Bifrost exposes an Anthropic-compatible endpoint, so the client never knows anything changed.
export ANTHROPIC_BASE_URL=http://localhost:8080/anthropic
export ANTHROPIC_API_KEY=dummy-key
The path is /anthropic, and not /v1/anthropic. And the key can be a placeholder because the real credentials live inside the gateway.
Gateway traffic is billed per token against API keys. It uses a separate meter from Pro or Max subscriptions, not a larger subscription allowance.
What a gateway will not fix
Four things, because a post that only lists the wins is a brochure.

It does not help with a 529. An overloaded error is Anthropic-wide capacity, so a fallback to Bedrock might dodge it, but no amount of key pooling on the direct API will.
It does not make a cross-provider fallback behave identically. Sonnet 5 on the direct API and Sonnet 4.5 on Bedrock are not the same model, and if your prompts are tuned tightly or you lean on a specific tool-calling shape, your fallback path needs its own evals. A fallback that silently produces worse answers is arguably worse than a clean 429.
It does not fix a workload that is simply too large. If you need 5x your current ceiling permanently, the answer is a tier increase or committed capacity, and routing is the bridge that gets you there without downtime in the meantime.
And the vendor benchmarks are vendor benchmarks. Bifrost's page claims 20 microseconds of added latency at 5,000 requests per second, and a 50x advantage on that same p99 number over LiteLLM. Those are Maxim's own numbers on Maxim's own harness, and you should treat them the way you treat every published benchmark, which is as a reason to go run your own.
What you should actually do, in order
Ordered by what each one costs you, cheapest first. Stop at the first one that fixes it.

One. Log the full error body and check for retry-after. If it is missing on a 429, you have a spend cap and no retry strategy will ever help you.
Two. Export the three anthropic-ratelimit-*-remaining headers as gauges. You cannot tune what you cannot see.
Three. Turn on prompt caching and check your hit rate on the Usage page. This is the single biggest win available and it costs you an afternoon, because cached reads do not count against ITPM on most models.
Four. Add retry-after-aware backoff with jitter, and make sure you are not stacking it on top of the SDK's own retries.
Five. Move anything non-interactive to the Message Batches API, which has its own separate rate limits.
Six. Request a tier increase. It is free and it is slow, so start it before you need it.
Seven. Only now, put a gateway in front and pool keys or channels. This is real infrastructure with real operational cost, and it is worth it once you have genuinely run out of ceiling, and mostly not before.
The reason I would put it dead last rather than first is that most 429s I have run into were not capacity problems at all. They were a cache that never got turned on, or a retry loop with no jitter, or a spend cap that everybody kept retrying into. Fix those and the ceiling stops being the constraint.
If you have hit a 429 shape that doesn't fit any of the five rows in that table, drop it in the comments, I'd genuinely like to see it. And if you want more of this sort of thing, I'm on X and I write everything up first on my site.